While it wasn’t my first dashboard, I will start with this one, as it just feels right to me!
As you can see elsewhere on this blog, I’m a fairly avid cyclist, and while not a health nut, a couple years ago, I decided to get in better shape by cycling. I was at that point 250 lbs, and one thing that I do do, while not stressing too much about it is keep track of my weight. I have a Garmin Venu watch, and while their visualizations are good, I kinda wanted my own too.
I keep track of my weight with a Withings scale. This does body composition things too, and I use an android app called Weight Logger to add the sync the readings to Garmin Connect. I also get sleep, and steps data from Garmin.
Like most cyclists, I do use Strava and I kinda liked some of their visualizations as well (within their built in dashboards). I like to keep track of my distance on my Bowflex bike, but I can’t get it to display/sync in Strava, so I kinda wanted to see my total distance there too, so those categorize activities come from Garmin.
On top of all that, I wanted the weather, because, well, without it, what would we have to talk about?
For all this, I have:
- Connection to Strava API via direct Grafana plugin
- Connection to Garmin API – stored in InfluxDB using Airflow
- Connection to OpenWeatherMap API – stored in InfluxDB using telegraf
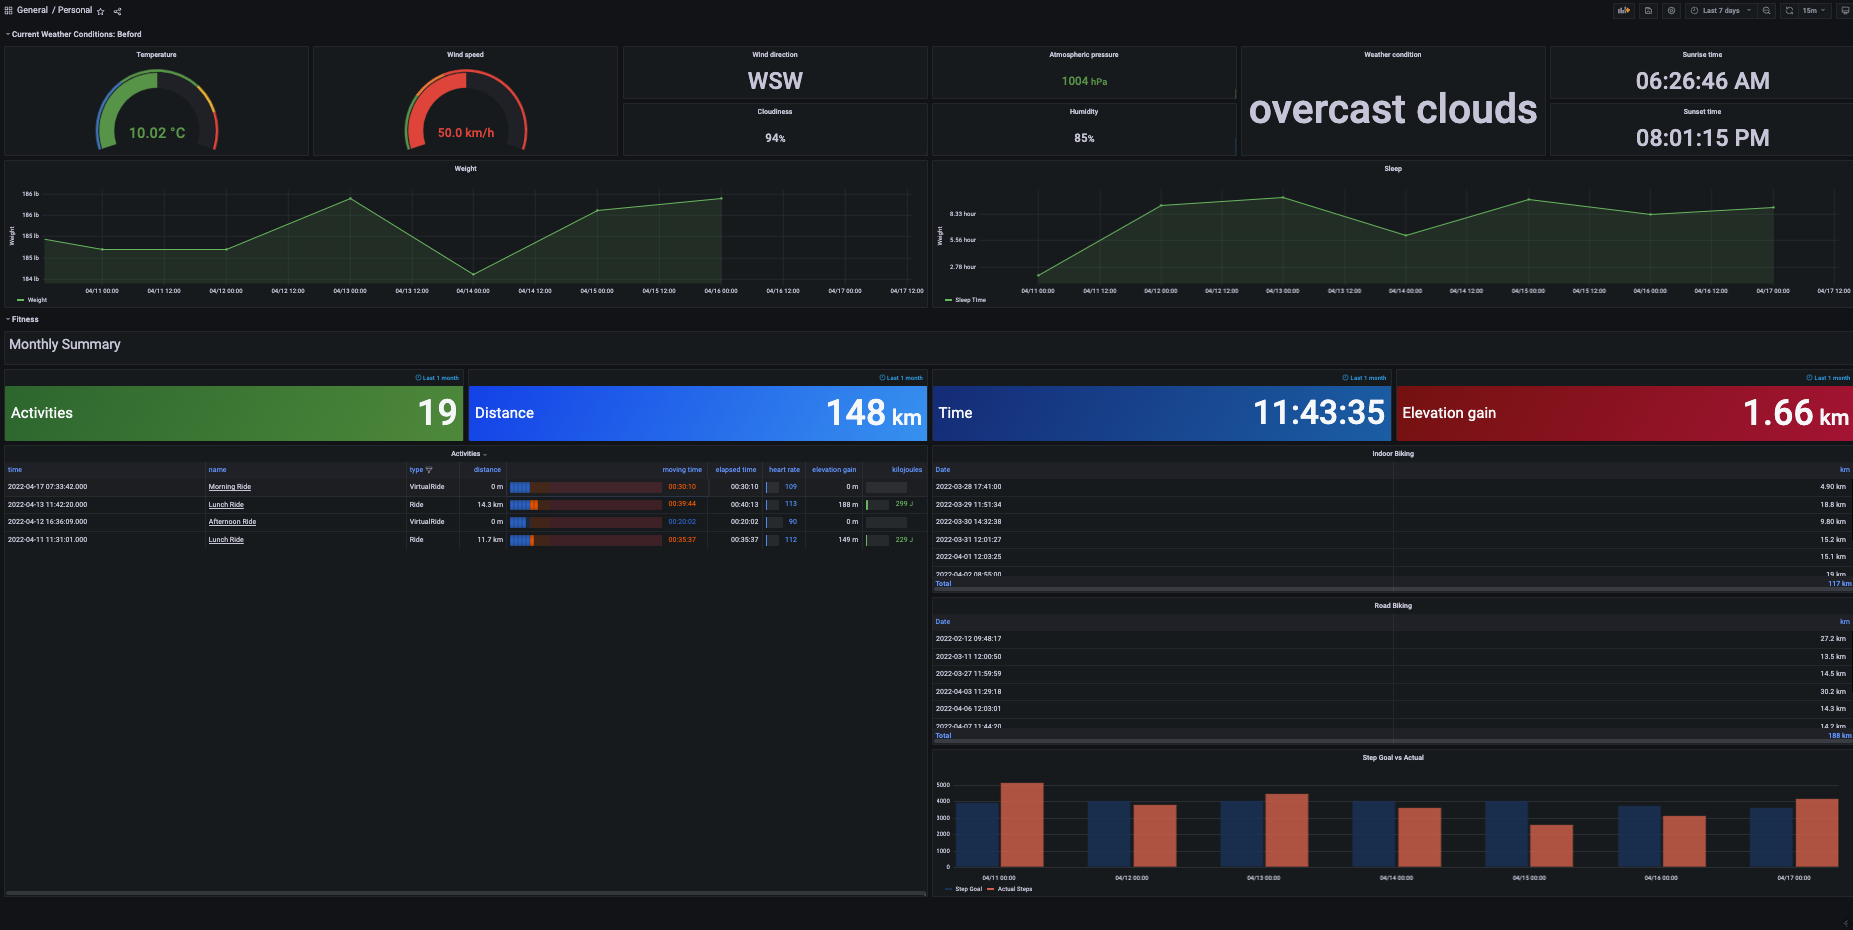
The final output of all this is this:

The API’s
Connecting all this together took me some work, but there was also some work in the initial set up. Let’s take them step by step.
Open Weather Map
For this you need to sign up for an API key (free) at their website. To get this data I used telegraf inputs. While there are templates for telegraf direct calls to OpenWeatherMap API, I couldn’t get them to refresh more frequently than once an hour. I was doing multiple cities, so that might be relevant. I ended up using the following config to get my weather. You can get the city codes by searching for cities on their website, and grabbing the id from the url.
[[inputs.http]]
urls = [
"https://api.openweathermap.org/data/2.5/weather?id=<cityid>&units=metric&appid=<apikey>",
"https://api.openweathermap.org/data/2.5/weather?id=<cityid>&units=metric&appid=<apikey>",
"https://api.openweathermap.org/data/2.5/weather?id=<cityid>&units=metric&appid=<apikey>"
]
name_override = "open_weather_map"
method = "GET"
interval = "10m"
timeout = "15s"
data_format = "json"
json_time_format = "unix"
json_time_key = "dt"
json_string_fields = ["weather_0_description", "weather_1_description", "weather_0_main", "weather_1_main", "name", "sys_country"]
tag_keys = ["sys_country", "name"]
Strava
You will also need to sign up for a Strava API key here. I had some problems with this with figuring out what to use for these values, as I wasn’t using a “real” url, and all this is internal, but I finally got this to work.

I then added the Grafana Strava plugin directly to access this data.
Garmin
For Garmin, I found this repo: https://github.com/stratus-ss/garmin-influxdb – I took much of this code and converted it to run in an airflow environment which I have in my personal repo.

With all that data now being available, I pieced together some panels to make a dashboard. Some from Strava’s plugin, some from OpenWeatherMap grafana dashboards (which didn’t seen to work as is for me, I had to tweak the FLUX queries) and some of my own from the garmin data.
I really don’t know FLUX querying very well, and have quite likely made a hacky job of all this, but it works for me! The dashboard config json for this can be found here.
I’m sure I’ve left out tons, please feel free to reach out to me on twitter with any questions!